My favourite bugs look simple on the surface, but the more you dig down, the more it feels like you’re falling down the rabbit-hole of abstract layers.
As an enterprise software developer, when you come across a bug, it’s often tempting to make the obvious fix immediately and move onto the next task. Sometimes it’s interesting to dig a bit deeper, especially when the bug is emanating from the lower layers – it’s a great opportunity to learn something new.
Here’s a real-life example of mine to show you could find. We’ll visit Kubernetes and it’s inner workings and even bits of the Linux kernel source code.
What was the bug?
I’ve been looking after a project involving the batch processing of millions of images, running on Kubernetes. Every couple of days, at night, a batch process inserts thousands of tasks onto the queue for our pool of workers to scale up , working through each task in a couple of seconds.
One morning, I found some alerts had gone off overnight, and our logs showed some of our Kubernetes containers were running out of memory and crashing. The bug itself was straightforward, but it did trigger my curiosity – what really happens when a container runs out of memory? What’s the exact sequence of events?
This isn’t going to be a story about why we were running out of memory on each container – instead, we’re going to walk through what is actually means to “run out of memory” if you’re running in Kubernetes: who is enforcing the limit, who notices when you run out of memory, and how do the different layers of the stack interact.
Before looking into this my understanding was essentially:
But there is much more to it than that, and a surprising amount of duct tape and string in some areas you might not expect.
The logs
Here’s those logs I was talking about, coming from our application:
 These are coming from Dramatiq, the Python task processing library which we use. Dramatiq runs multiple processes – a supervisor process spawns multiple worker subprocesses, each of which will pick up work from the queue. The complaint here is that one of these workers has been sent the SIGKILL signal causing it to terminate immediately. A process that gets a SIGKILL is not even notified about it and has no chance to clean up after itself, but the parent process does notice when one of its children has died, and that’s what we see here.
You might already be thinking that this is an out of memory problem, and you’d be right! Kubelet, the Kubernetes agent program that runs on each node (which we’ll see more of this later), says:
 OOM is a commonly used abbreviation for Out Of Memory. This log is saying that there was an out of memory event on the node, a process was killed, in order to fooproc was chosen to free up some memory.
And the kernel logs from the node itself look like this:
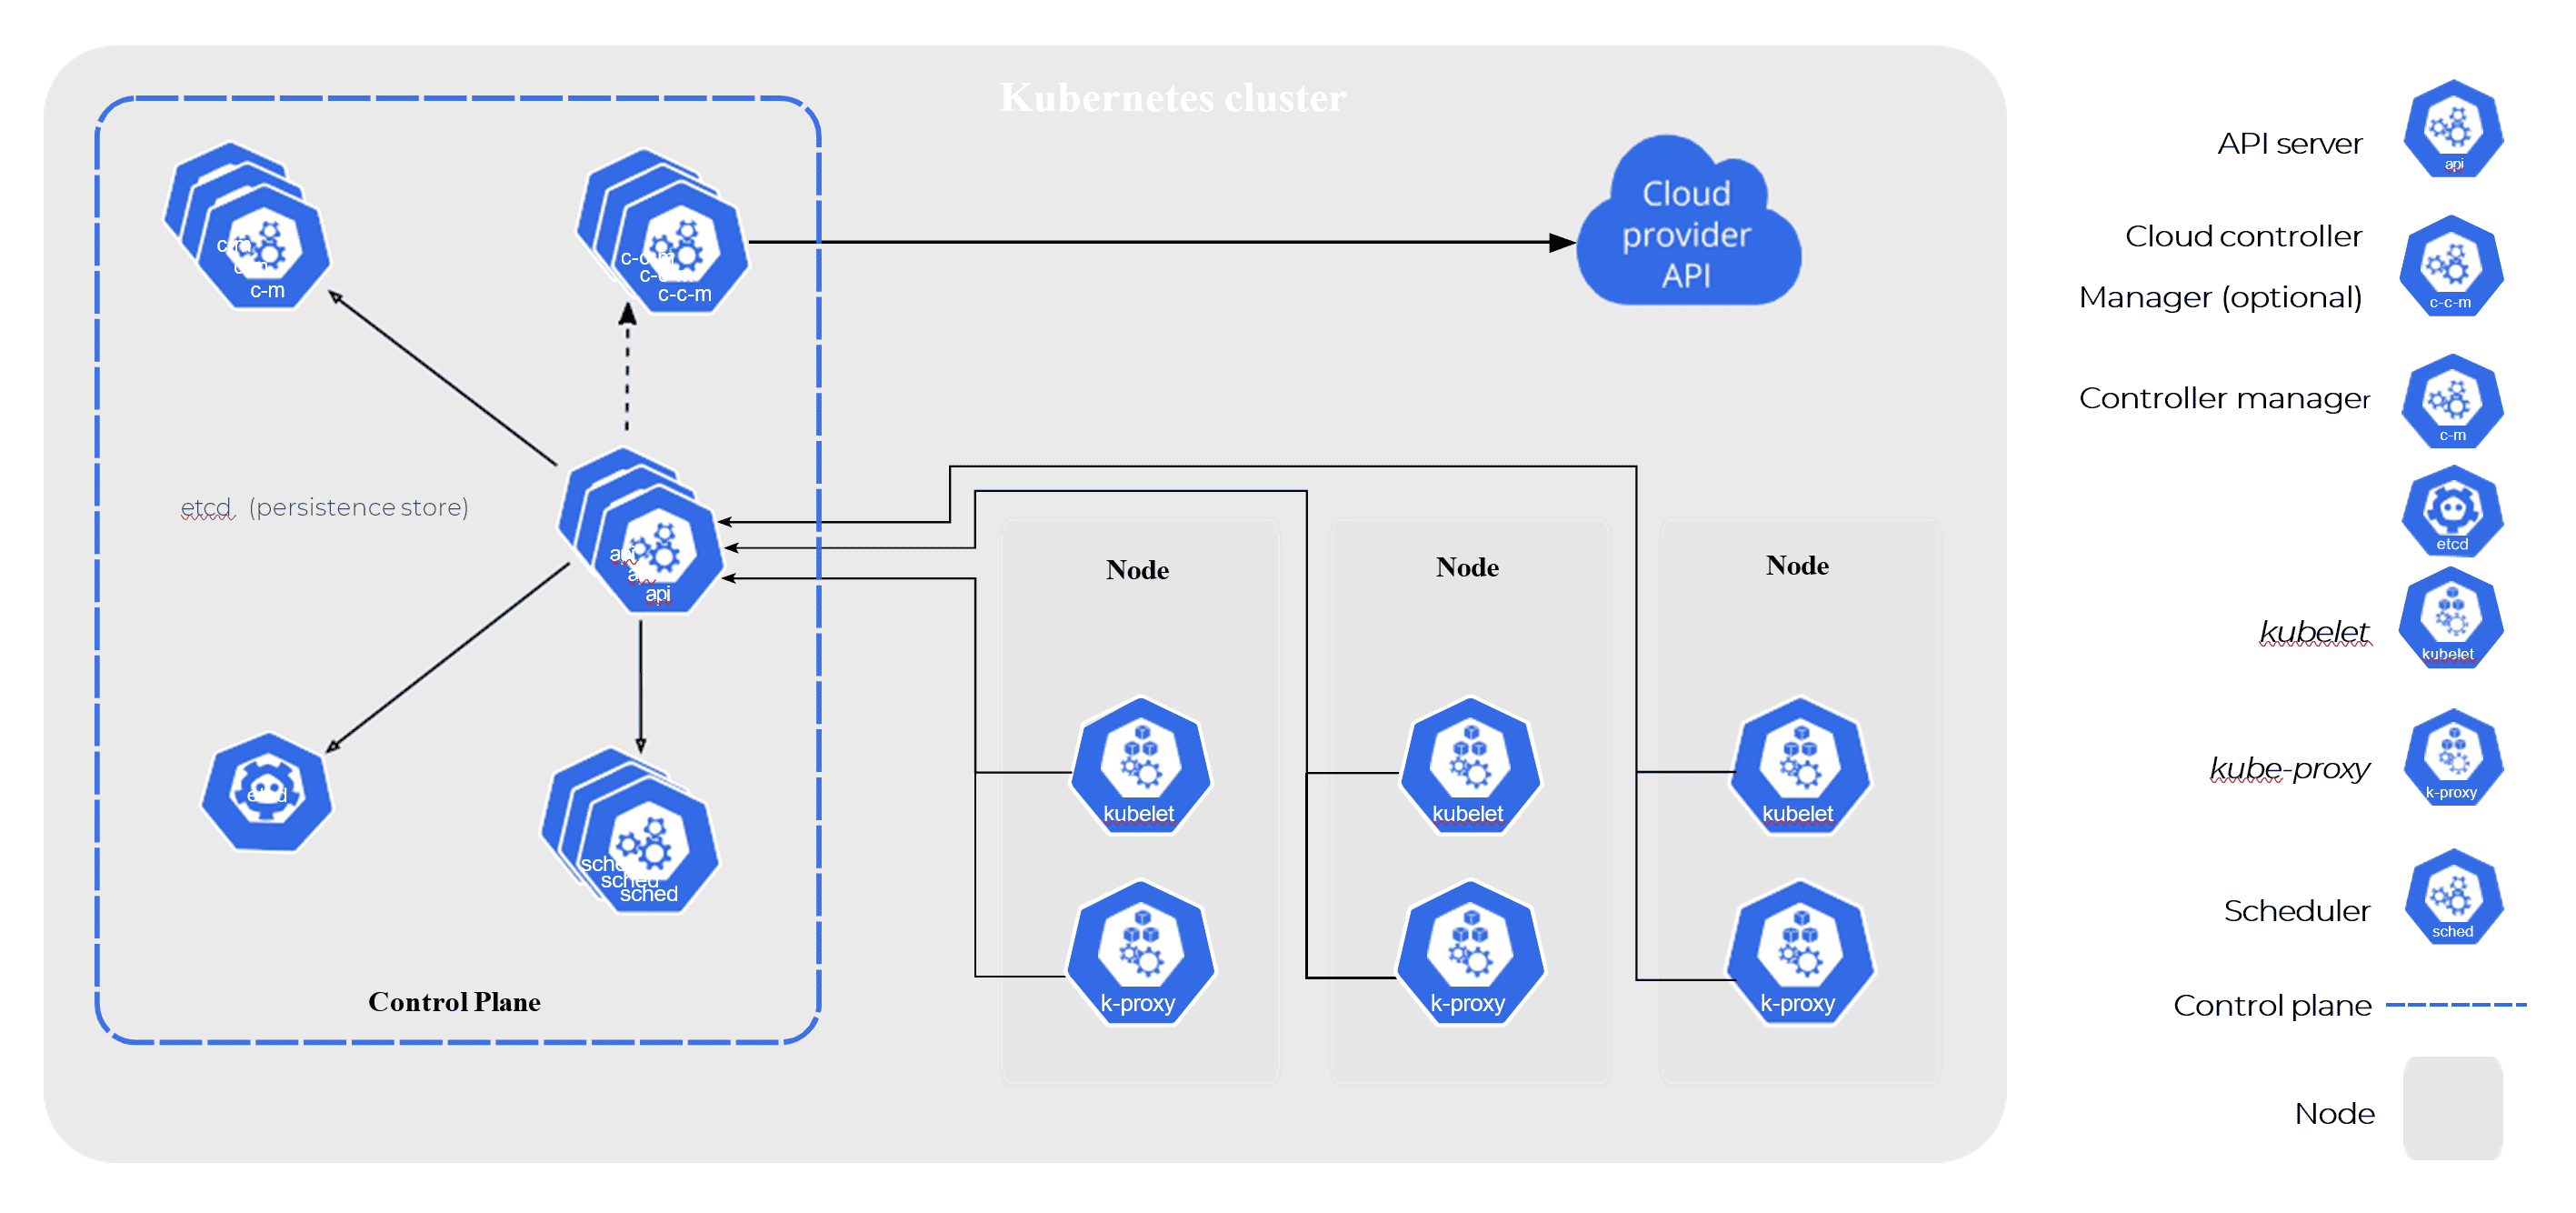
 A brief aside for people not familiar with Kubernetes: a Kubernetes deployment typically runs across a bunch of nodes. Each node could be a virtual machine or a bare metal box, it doesn’t matter too much. For our purposes you just need to know that each node is running:
- A bunch of containers, in our case our image processing container;
- kubelet, a Kubernetes program which manages the containers running on the node; and
- Some other useful Kubernetes programs which we won’t need to talk about (You can read about this more in these docs, which is also where I got the picture below)

Ok, so clearly my image processing container is hitting some memory limit and being killed. But this leaves us with a lot of questions:
- What’s the exact order of events here
- Who is responsible for what
- Why is the worker process killed and not the supervising process
- How did Kubelet find out about it, and
- What are some of these arcane sounding terms like oom_score_adj?
Down the rabbit hole: cgroups
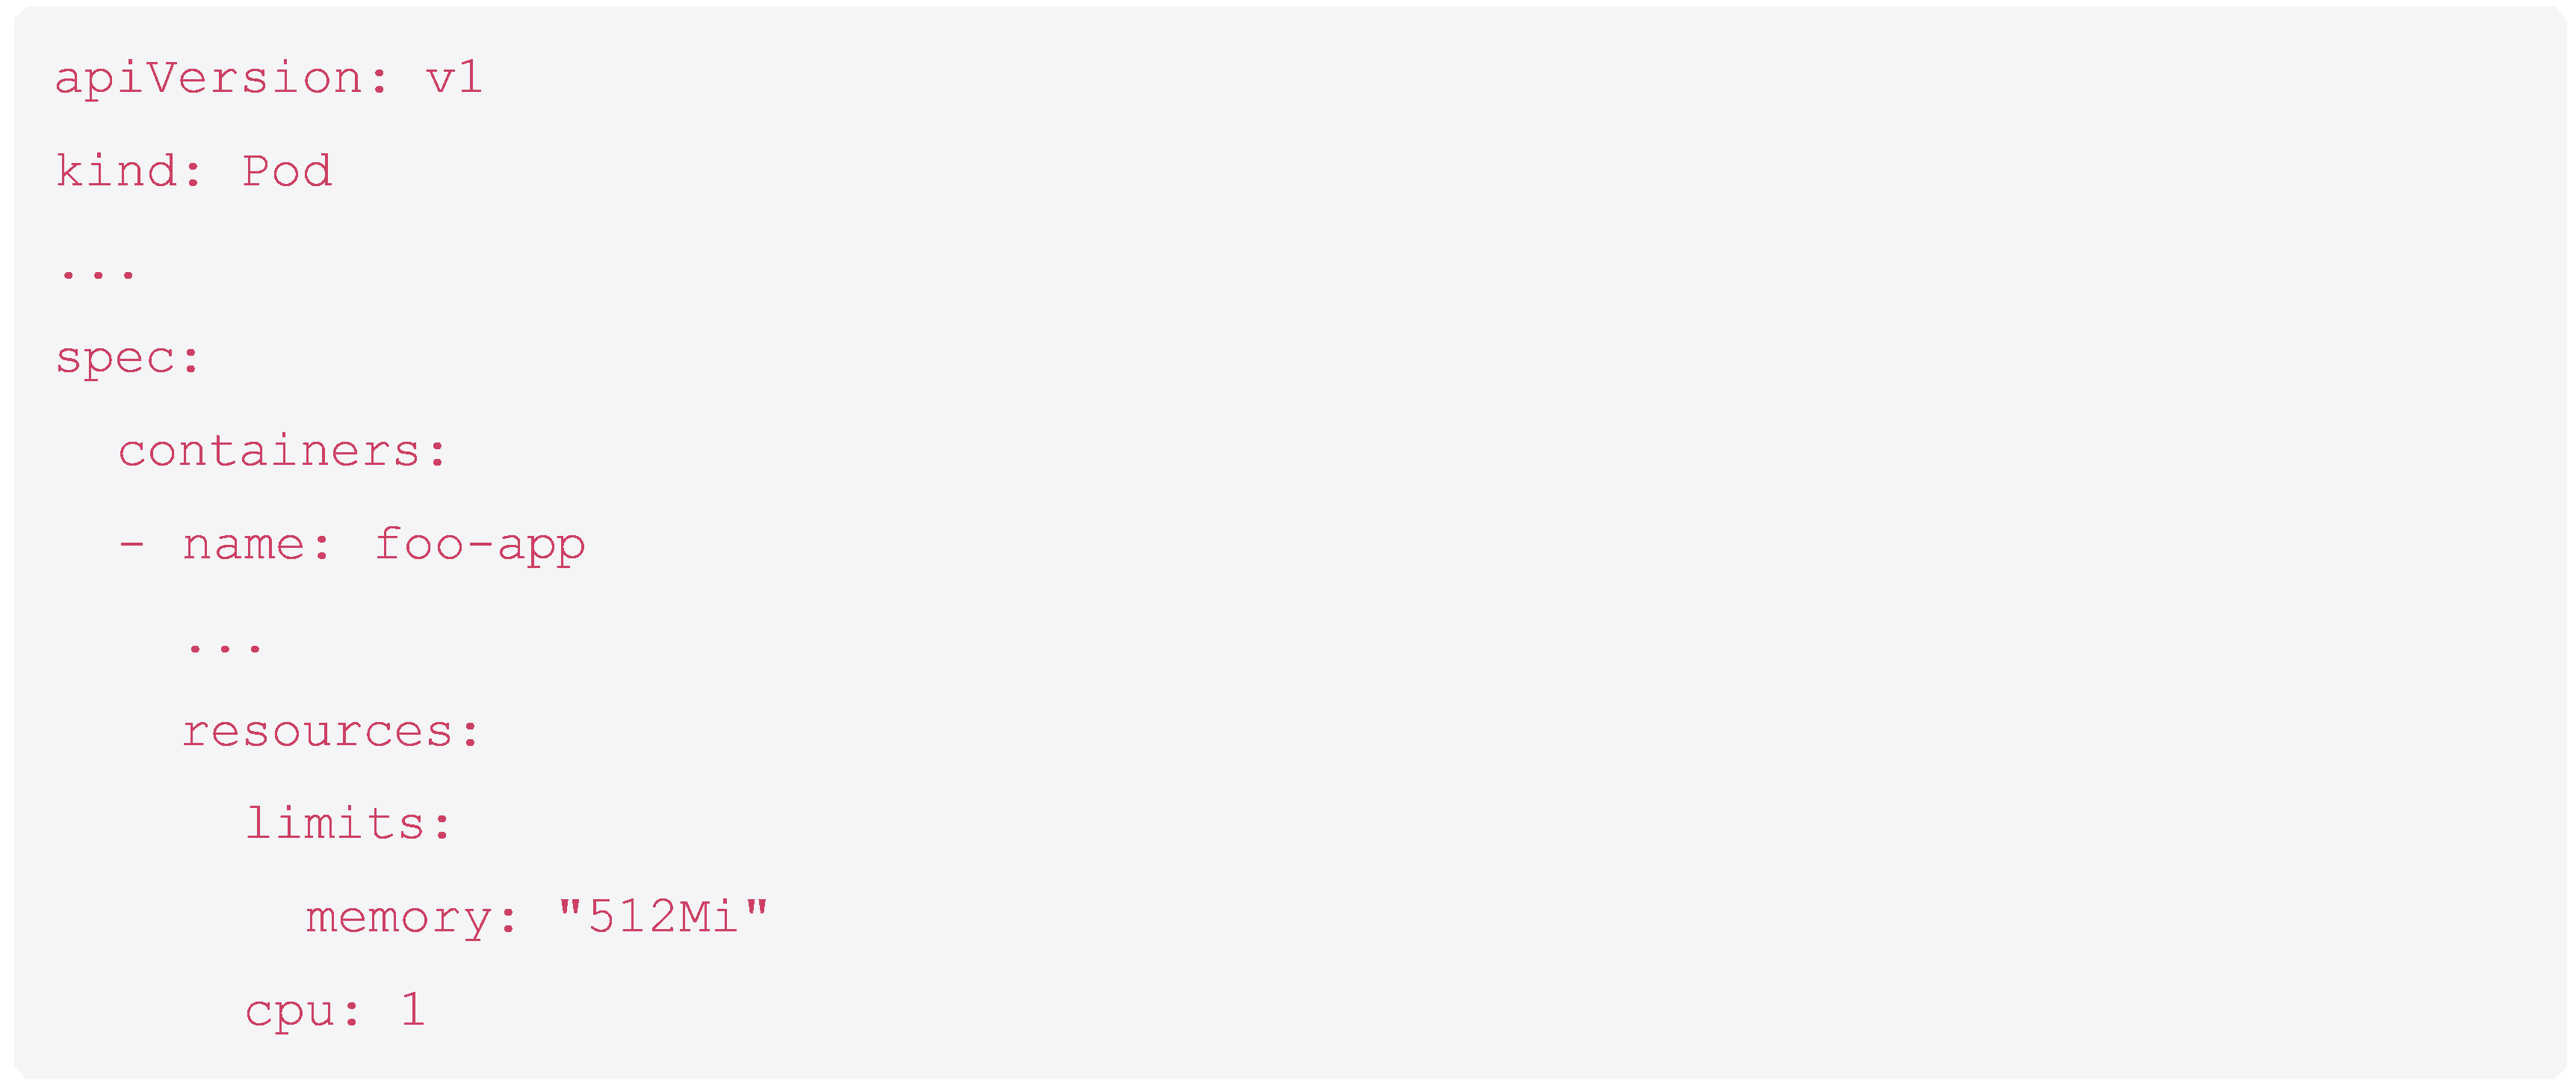
If you’ve used Kubernetes before you’ve probably written code like this:

This snippet of a manifest is telling Kubernetes the maximum amount of memory and of CPU time that my container is allowed to use.
Kubernetes doesn’t actually enforce these constraints itself, it passes these directly to a container runtime in our case containerd, which uses them to create a cgroup for our container(s).
Let’s forget about Kubernetes completely for a while and just think about cgroups. cgroups have been around since 2008 as a way of limiting the resource usage of processes and are part of the Linux kernel . A set of processes in a memory cgroup can use no more than their allotted quantity of memory, and a set of processes in a CPU cgroup can use no more than their allotted CPU bandwidth.
The kernel can ensure that a process doesn’t use too much CPU bandwidth in a fairly straightforward way, by not scheduling more to it than its allotted time. But memory is not so straightforward, memory can’t be throttled. Instead, if your cgroup runs out memory, the kernel has no choice but to kill one of the processes .
If you’ve got too much time on your hands, you can setup some cgroups and watch this happen yourself. In a typically Linux fashion, cgroups are implemented using a virtual filesystem. In other words you can create and configure them by writing into some “magic” files in a “magic” filesystem. You’ll need to be root run these commands:

Now create a process which eats up more and more memory every second (creating this is left as a fun exercise to the reader) and add it to the cgroup:

In no time at all, it’s dead. Here’s the kernel log:

The OOM killer
Who’s killing the processes in my cgroup? And how do they know which process to kill? Enter the OOM killer.
The OOM killer predates cgroups by a long time. When running without cgroups it’s invoked when the whole system is running on is critically low on memory, when running with cgroups it’s additionally called upon when a cgroup has used up all of it’s allotted memory.
Unlike almost all the Linux kernel code, which I have consistently failed to understand in the past, the OOM killer code is unreasonably straightforward to read, even for an application developer like me who’s exposure to C is almost non-existent.
When an out of memory occurs we end up at the out_of_memory function. This function chooses a process which has the highest badness score, that process is killed, and the memory reclaimed.
Let’s look at some key snippets of code. The “badness score” is calculated by adding up all the memory in use by the process:

This is normalised by adding the oom_score_adj. This is a per-process value which is used to make some processes more likely to be killed by the kernel than others.

An aside, you may have noticed that our original log message had a non-default value – the default is 0 but we have 969?
This is Kubernetes itself. If the node itself is running low on memory then Kubelet will try and free up some memory by evicting pods – but if it can’t do this quick enough then the OOM killer will spring into action – and Kubernetes wants to make sure that any containers are killed before programs like Kubelet.

The process is killed:

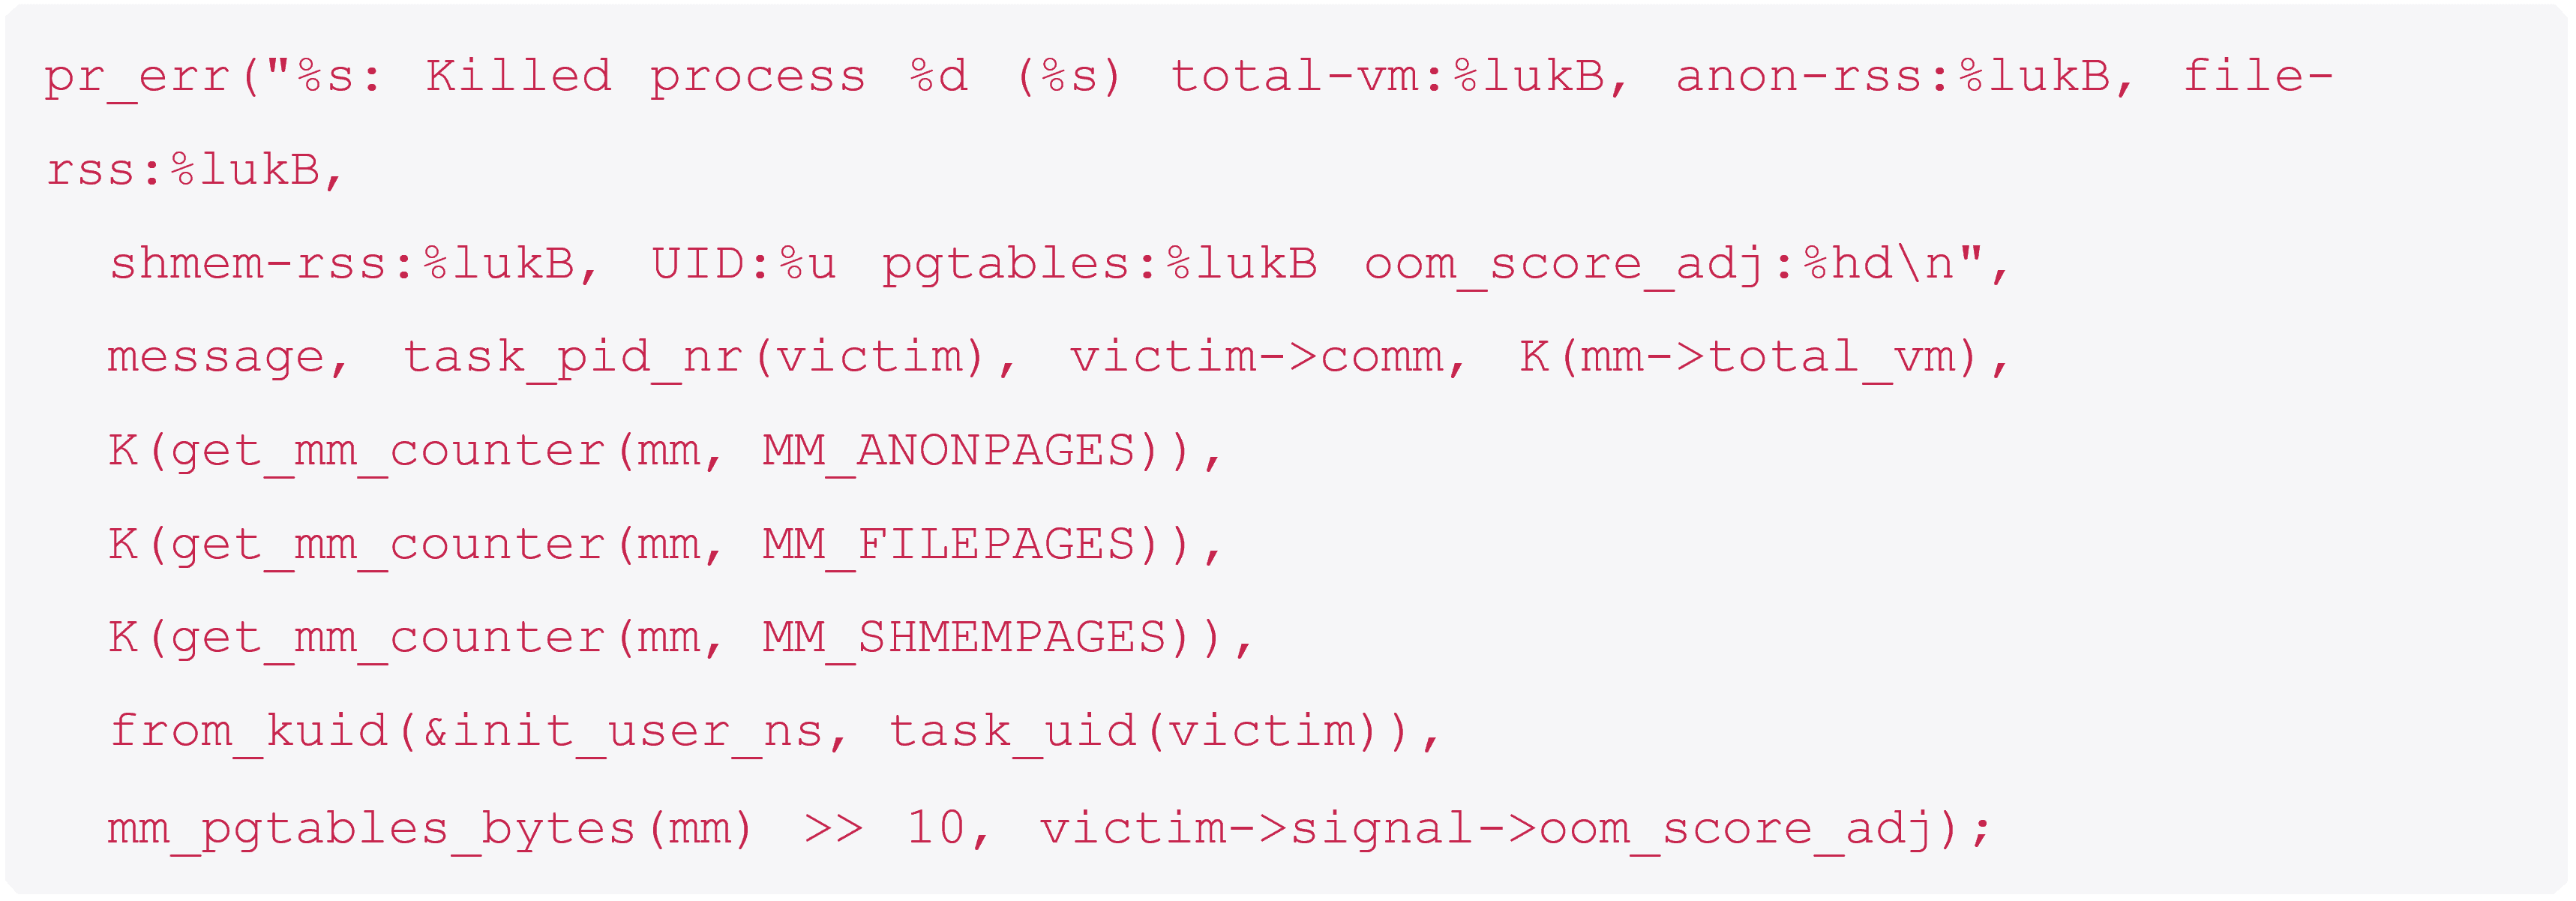
And finally, we get the log message we saw at the very beginning.
If you’re keeping score, that means we have found 2 out of 3 pieces of the log message puzzle so far (from the application itself and from the Linux kernel, we are still missing the log from Kubernetes).

How does Kubernetes find out?
To recap the situation so far: When I start a container in Kubernetes I can give it some resource limits, these are passed through the container runtime to the Linux kernel where a cgroup is created for all the processes in my container. When my worker process uses too much memory the OOM killer is called in, it calculates that my worker process has the highest badness score, and it’s killed leaving a log message in the kernel log. The supervisor process notices that one of its worker processes is dead and we see the log from the very beginning.
But if we look back right back to the top, there’s some logs from Kubelet too saying there was an out of memory event, how did it know?
The answer turns out to be surprisingly low-tech. There is no clever signalling mechanism: someone is parsing the kernel ringbuffer with a regex (Remember I said there was some duct tape and string involved?):

That someone is cAdvisor, used by Kubelet’s OOM watcher , which converts these into a Kubernetes event. Events are a Kubernetes resource which is generated in response to state changes in other resources, you’ll have seen them if you run kubectl describe pod my-pod, scroll to the end of the output, and see a list of events describing the lifecycle of your pod (Scheduled, Created, Started, and so on; maybe CrashLoopBackOff if you’re unlucky).
Final Thoughts
So, what can we take from this, aside from the realization that you’re never far from a regex being used for something unexpected.
Picking something small like this is a great way to get a feeling for how the whole stack sits together – and given it’s all open-source you can look at all the code in each layer.
Don’t be afraid of jumping into unfamiliar or scary codebases like Kubernetes, or even the Linux Kernel. Even for someone like me, whose bread and butter is enterprise software development, it can be manageable.
If you liked my article, share this with your peers and friends.
***
We use KEDA (Kubernetes event driven autoscaling) to scale up to hundreds of nodes when there’s work to be done, and back down to zero when there isn’t, but that’s a story for another day.
OOM stands for “Out of Memory”, I’ll explain more about what this means and who/what the OOM killer is later.
I’ve replaced the actual name of the process with fooproc here – we don’t actually call our processes fooproc!
I don’t want to dive too deeply into what this actually means, so let’s just say that a container runtime is responsible for actually running the containers. There are a few supported runtimes but the most common is containerd.
The docs in that previous link are for cgroups v1, because that’s the version of cgroups which is in use on my cluster, but for completeness there is a version 2 of cgroups and this is supported by k8s.
I’m ignoring swapping here, where the kernel writes some pages of memory to disk in order to free up more space. This is because, as is common practice, my Kubernetes nodes run without swap. This is another bit of the rabbit hole which I don’t want to fall down yet, but if you do you could start with the linux kernel docsor the kubernetes docs. If you did have swap then the kernel has one more option – it can swap out as much memory as possible.
cAdvisor is short for container advisor and is a program which collects resource usage and performance statistics for running containers, you can run it separately but it’s actually built-in to the kubelet binary.


